|
ArrayGen introduces its new service for the custom script development throughout globe. Programming can be done using Perl/Python/Java. Anyone interested to develop tools /software/databases/any publication report generation and if needed programming skilled support we request you to contact us at email info@arraygen.com or call us on mobile +91-9673625446.
Also, we have started depositing some free scripts for public use and we will be adding more scripts soon. Hope the ready to use script will help all researchers or any life science professional to use in there research work.
|
|

|
|
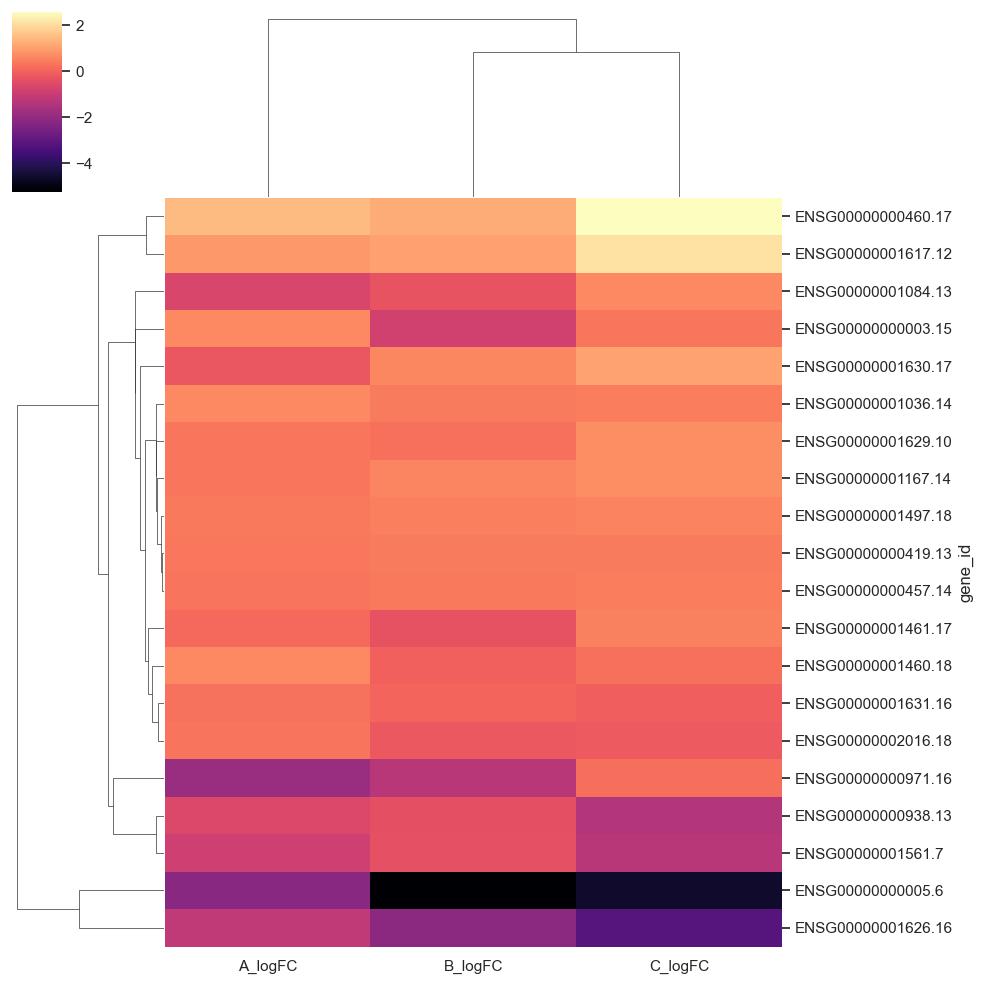
Heatmap
The heatmap may also be combined with clustering methods which group genes and/or samples together based on the similarity of their gene expression pattern.
This can be useful for identifying genes that are commonly regulated, or biological signatures associated with a particular condition.
For heatmap you need pandas modules such as seaborn, pandas, numpy ,sys, matplotlib.
This program will take input file of extension .csv /.xlsx /.xls in which one of the
columns must be gene_id which is having ensemble_id/gene symbol
(***if not rename it as gene_id)
and other columns must be all logFC columns containing logFC values
To get Heatmap use bellow commands:
|
|
|
Program: python3 heatmap.py input/heatmapintput.xlsx
python3: version of pythonheatmap.py: code fileinput/heatmapintput.xlsx: folder name and name of the file (path of file with its full name)
Usage: python3 heatmap.py [input file path]
After Executing by Enter you have to provide options on terminal/command prompt
Options:
| 1. | Optional.Enter the colors separated by coma(this is optional ,if you skipped it will take default colors) |
| 2. | Optional.Do you want to provide row cluster? (y/n) |
| 3. | Optional. Do you want to provide column cluster?(y/n) |
| 4. | Optional. Do you want to provide xticklabels? (y/n):(will display label to x axis) |
| 5. | Optional. Do you want to provide yticklabels? (y/n):(will display label to y axis) |
| 6. | Optional. Do you want to provide row color bar ? (y/n): (y/n):(will display row color bar with heatmap) |
OUTPUT :
You will get two heatmap file in output folder
1.top 20 samples heatmap
2.all sample heatmap
|
|
| |

|
|
Volcano Plot
A volcano plot is a type of scatterplot that shows statistical significance (P value) versus magnitude of change (fold change).
In a volcano plot, the most upregulated genes are towards the right, the most downregulated genes are towards the left, and the most statistically significant genes are towards the top.
For volcano plot you need pandas modules such as bioinfokit, pandas, numpy sys, matplotlib.To get volcano plot use bellow commands:
|
|
|
Program: python3 volcano.py input/data.csv
Usage: python3 volcano.py [input file path]
After Executing by Enter you have to provide options on terminal/command prompt
Options:
| 1. | Compulsory. Name of a column having log or absolute fold change values |
| 2 | Compulsory. Name of a column having P-values or adjusted P-values "\t" |
| 3 | Compulsory. Name of the column having Ensemble_GeneID |
| 4 | Compulsory. gene_name |
|
| 5 | Compulsory. Log or absolute fold change cutoff for up and downregulated genes |
| 6 | Compulsory. P-values or adjusted P-values cutoff for up and downregulated genes |
| 7 | Optional. do you want to grid lines on plot with defined log fold change (lfc_thr) and P-value (pv_thr) threshold value(y/n) |
| 8 | Compulsory. name of figure |
|
OUTPUT:
You will get Volcano plot with entered Name with cutt off value which you entered
|
|

|
|
Wiggle
Wiggle format is line-oriented. Wiggle format is composed of declaration lines and data lines,
and require a separate wiggle track definition line. Text files in wiggle format can be uploaded as custom tracks as-is to UCSC for visualization. Wiggle files allow you to plot quantitative data as either
shades of color (dense mode) or bars of varying height (full and pack mode) on the genome.
To Execute you need install pandas liberary package as given in hot_To_use file in downloaded zip
|
|
|
Program :python3 wiggle.py input/mouse.txt
Usage: python3 [program].py [input file path]
Place the text file into input folder.
the file should be txt etension with tab separated and contains ["chr","start","end","Gene symbol"] this must be the first row
| chr |
start |
end |
Gene symbol |
M1 |
M2 |
M3 |
M4 |
M5 |
| chr8 |
52853949 |
52853949 |
1190028D05Rik |
10 |
7 |
17 |
12 |
9 |
| chr8 |
52854012 |
52854012 |
1190028D05Rik |
4 |
20 |
19 |
19 |
13 |
OUTPUT:
wiggle file will create in output folder with file name that u have provided for input.
|
|

|
|
Reverse,Complement and Reverese Compliment Of Sequence
Reverse is reversing the order of nucleotides in a sequence
Complement is complementing a sequence means replacing each nucleotide
with its complementary nucleotide.Complementing a sequence can be
important when determining the base-pairing properties of a sequence
Reverse complement of a sequence combines both reversing and complementing
operations
To Execute you need install biopython package as given in hot_To_use file in downloaded zip.
|
|
|
For reverse
Program :python3 reverse.py input/sequence.fasta
For Complement
Program :python3 complement.py input/sequence.fasta
For Reverse Complement
Program :python3 reversecomp.py input/sequence.fasta
Usage: python3 [program].py [input file path]
OUTPUT:
Reverse: You will get reverse of of each record present in input fasta file which will be saved in reverse_your_file_name.fasta
Complement: You will get complement of of each record present in input fasta file which will be saved in complement_your_file_name.fasta
Reverse Complement:You will get reverse complement of of each record present in input fasta file which will be saved in reverse_your_file_name.fasta
|
|

|
|
Feature Count From Fasta Sequence
This program will take input file which have multiple/single fasta sequences and generated count A , Count T, Count C, Count G, Others
and also calculate %GC for each fasta sequence and create output in csv format
To run the file, use python3 ATGC_count.py
the file_path is actual path where the file is saved
|
|
|
Program :python3 ATGC_count.py input/sequence.fasta
Usage: python3 [program].py [input file path]
OUTPUT:
you will get your_file_name.csv in output folder
|
|
| |

|
|
FastQC To Fasta Format
This program will take fastq file as input and it converts fastq to fasta format file for each record
and calculates length of sequence, A,T,G,C count ,GC%, and others for each and store in csv file
For fastqc report you need pandas,sys modules of python.
To get fastqc report use bellow steps / Read README file which is given in downloaded zip:
|
|
|
To run the file copy the ,use python3 Fastq_to_Fasta.py
the file_path is actual path where the file is saved :
python3 Fastq_to_Fasta.py input/mouse.fastq
Usage: python3 Fastq_to_Fasta.py [input file path]
OUTPUT :
After Executing this script you will get two files 1.filename.fasta fasta file with your input file name which contains fasta format of record
2.filename.csv which contains length of sequence, A,T,G,C count ,GC%, and others of each record
|
Check your outputs in each respective output folder
|
|
|


